Description of Bar Chart
Overview
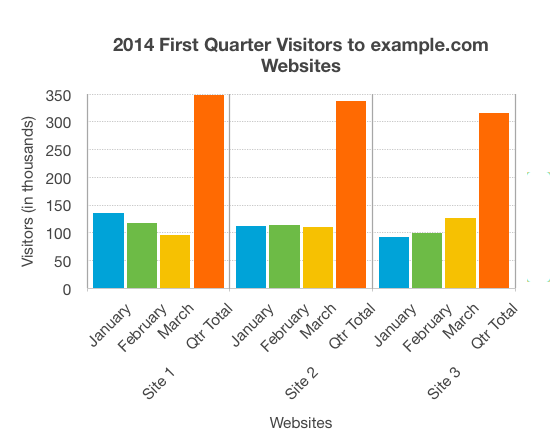
The chart shows the website hits for the first quarter of 2014. It shows that Site 1 has more visitors than either of the other sites, but the number of visitors is decreasing. Site 2 has a fairly constant number of visitors, while for Site 3 page hits are increasing month on month.
Data
| Period | Site 1 | Site 2 | Site 3 |
|---|---|---|---|
| Jan | 135 | 112 | 92 |
| Feb | 117 | 114 | 99 |
| Mar | 96 | 111 | 126 |
| Qtr Total | 348 | 337 | 308 |
Presentation
The bar chart represents both the number of visitors per month for each website, and the total number of visitors per website for the entire quarter. Website visitors for each month are represented using columns lined up horizontally, with heights indicating the number of visitors. A fourth column is provided for each website with the accumulated site visitors for the quarter.